
I think the knowledge about PerfMon (a tool embedded in Windows, majoring in System Performance Browse) can help you determine the bottleneck of your PC.
The Original Link is :http://adminfoo.net/2007/04/windows-perfmon-top-ten-counters.html
*********************************************************************************
Windows Perfmon: The Top Ten Counters
One of the things I love about Windows is Performance Monitor a/k/a PerfMon. It's an amazing tool that goes far too often unused - and when it does get used, it is often misinterpreted. So today I'm going to take you on the nickel tour through PerfMon, and the ten counters most valuable to determining overall system health and activity.
To open PerfMon, just go to the Start Menu, choose Run and type perfmon.
Bottleneck analysis
The most common use of PerfMon is to answer the burning question: why is my system running slow?
With the five performance counters listed below, you can quickly get an overall impression of how healthy a system is - and where the problems are, if they exist. The idea here is to pick counters that will be at low or zero values when the system is healthy, and at high values when something is overloaded. A 'perfectly healthy' system would show all counters flatlined at zero. (Perfection is unattainable, so you'll probably never see all of these counters flatlined at zero in real life. The CPU will almost always have a few items in queue.)
Pay close attention to the scale column! Perfmon attempts to automatically pick a scale that will magnify or reduce the counter enough to produce a meaningful line on the graph ... but it doesn't always get it right. As an example, Perfmon often chooses to multiply Disk Queue Length by 100. So, you might think the disk queue length is sustained at 10 (bad!) when in fact it's really at 1 (good). If you're not sure, highlight the counter in the lower pane, and watch the Last and Average values just below the graph. In the screenshot below, I modified all of the counters to a scale value of 1.0, then changed the graph's vertical axis to go from 0-10.
To change graph properties (like scale and vertical axis as discussed above), rightclick the graph and chooseProperties. There are a number of things to customize here ... fiddle with it until you have a graph that looks good to you.
To get a more detailed explanation of any counter, rightclick anywhere in the perfmon graph and choose Add Counters. Select the counter and object that you are curious about, and click the Explain button.
This screenshot shows a very lightly-loaded XP system, with the Memory\Pages Input/Sec counter highlighted:
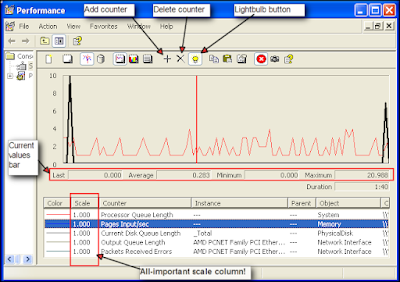
All we see here is the Proccessor Queue Length hovering between 1 and 4, and two short spikes of Pages Input/Sec. All other counters are flatlined at zero, which is easy to check by highlighting each of them and watching the values bar underneath the graph. This is a happy system - no problems here!
But if we saw any of the above counters averaging more than 2-4 for long periods of time (except Processor Queue Length: don't worry unless it's above 10 for long lengths of time), we'd be able to conclude that there was a problem with that subsystem. We could then drill down using more detailed counters to see exactly what was causing that subsystem to be overloaded. More detailed analysis is beyond the scope of this article, but if there's enough interest I could do a second article on that. Leave a comment if you're interested!
General activity counters
Well, the system is healthy - and that's good ... but how hard is it working? Is the processor workin' hard, or hardly workin'? How much RAM is in use, how many bytes are being written to or read from the disk or network? The following counters are a good overview of general activity of the system.

And ... that's all for now. Hopefully this quick show-and-tell has given you enough information to use PerfMon more usefully in the future!
To open PerfMon, just go to the Start Menu, choose Run and type perfmon.
Bottleneck analysis
The most common use of PerfMon is to answer the burning question: why is my system running slow?
With the five performance counters listed below, you can quickly get an overall impression of how healthy a system is - and where the problems are, if they exist. The idea here is to pick counters that will be at low or zero values when the system is healthy, and at high values when something is overloaded. A 'perfectly healthy' system would show all counters flatlined at zero. (Perfection is unattainable, so you'll probably never see all of these counters flatlined at zero in real life. The CPU will almost always have a few items in queue.)
- Processor utilization
- System\Processor Queue Length - number of threads queued and waiting for time on the CPU. Divide this by the number of CPUs in the system. If the answer is less than 10, the system is most likely running well.
- Memory utilization
- Memory\Pages Input/Sec - The best indicator of whether you are memory-bound, this counter shows the rate at which pages are read from disk to resolve hard page faults. In other words, the number of times the system was forced to retreive something from disk that should have been in RAM. Occasional spikes are fine, but this should generally flatline at zero.
- Disk Utilization
- PhysicalDisk\Current Disk Queue Length\driveletter - this is probably the single most valuable counter to watch. It shows how many read or write requests are waiting to execute to the disk. For single disks, it should idle at 2-3 or lower, with occasional spikes being okay. For RAID arrays, divide by the number of active spindles in the array; again try for 2-3 or lower. Because a shortage of RAM will tend to beat on the disk, look closely at the Memory\Pages Input/Sec counter if disk queue lengths are high.
- Network Utilization
- Network Interface\Output Queue Length\nic name - is the number of packets in queue waiting to be sent. If there is a sustained average of more than two packets in queue, you should be looking to resolve a network bottleneck.
- Network Interface\Packets Received Errors\nic name - packet errors that kept the TCP/IP stack from delivering packets to higher layers. This value should stay low.
Pay close attention to the scale column! Perfmon attempts to automatically pick a scale that will magnify or reduce the counter enough to produce a meaningful line on the graph ... but it doesn't always get it right. As an example, Perfmon often chooses to multiply Disk Queue Length by 100. So, you might think the disk queue length is sustained at 10 (bad!) when in fact it's really at 1 (good). If you're not sure, highlight the counter in the lower pane, and watch the Last and Average values just below the graph. In the screenshot below, I modified all of the counters to a scale value of 1.0, then changed the graph's vertical axis to go from 0-10.
To change graph properties (like scale and vertical axis as discussed above), rightclick the graph and chooseProperties. There are a number of things to customize here ... fiddle with it until you have a graph that looks good to you.
To get a more detailed explanation of any counter, rightclick anywhere in the perfmon graph and choose Add Counters. Select the counter and object that you are curious about, and click the Explain button.
This screenshot shows a very lightly-loaded XP system, with the Memory\Pages Input/Sec counter highlighted:

All we see here is the Proccessor Queue Length hovering between 1 and 4, and two short spikes of Pages Input/Sec. All other counters are flatlined at zero, which is easy to check by highlighting each of them and watching the values bar underneath the graph. This is a happy system - no problems here!
But if we saw any of the above counters averaging more than 2-4 for long periods of time (except Processor Queue Length: don't worry unless it's above 10 for long lengths of time), we'd be able to conclude that there was a problem with that subsystem. We could then drill down using more detailed counters to see exactly what was causing that subsystem to be overloaded. More detailed analysis is beyond the scope of this article, but if there's enough interest I could do a second article on that. Leave a comment if you're interested!
General activity counters
Well, the system is healthy - and that's good ... but how hard is it working? Is the processor workin' hard, or hardly workin'? How much RAM is in use, how many bytes are being written to or read from the disk or network? The following counters are a good overview of general activity of the system.
- Processor utilization
- Processor\% Processor Time\_Total - just a handy idea of how 'loaded' the CPU is at any given time. Don't confuse 100% processor utilization with a slow system though - processor queue length, mentioned above, is much better at determining this.
- Memory utilization
- Process\Working Set\_Total (or per specific process) - this basically shows how much memory is in the working set, or currently allocated RAM.
- Memory\Available MBytes - amount of free RAM available to be used by new processes.
- Disk Utilization
- PhysicalDisk\Bytes/sec\_Total (or per process) - shows the number of bytes per second being written to or read from the disk.
- Network Utilization
- Network Interface\Bytes Total/Sec\nic name - Measures the number of bytes sent or received.

And ... that's all for now. Hopefully this quick show-and-tell has given you enough information to use PerfMon more usefully in the future!
没有评论:
发表评论